Kumasi region: location
The second city of Ghana is located in the Ashanti region with strong tribal identities and social structures.
Peri-urban areas are growing mainly by middle class encroachment, under a dual ‘customary’ legal system, displacing the land and livelihoods of many indigenes.
In this tropical rainforest location, climate-environment risks include flooding, water scarcity, extreme heat and wildfire. Built and developed as a concentric city, the city is radiated by 5 main corridors, the corridors connect Kumasi to wider Ghana. The peri-urban devolvement occurs along the major corridors. Peri-urbanisation is led by individuality, local and traditional land management combined with planning agencies. The reality is traditional leaders are determining land use, due to a weak planning system. Land along major corridors is highly sought. The production of infrastructure also drives peri-urban change. Land speculation around the University. Expansion of Kumasi airport, production of a major industrial hub (vehicles and meat) these are driving localised peri-urbanisation. The concentricity of the city drives the peri-urbanisation location.
People buy land and develop it before they have sought permission from planning authority. Land bought from traditional owners. First housing is built, then access to infrastructure is considered.
Westernisation of the middle class is changing the housing preferences from compound housing to nuclear family living, greater peri-urbanisation. Citizens living in the peri-urban are typically middle class and up.
In the city suburbs they migrate out and lower income communities can move in. Some living in slums are rich and saving to redevelop their home town.
Many of those living in slums are migrants to the city.
In Kumasi there are small communities that live around the cities, farming communities (subsistence). The subsistence farmers cannot afford to buy their land, the tribal leaders can sell it off. Even if land is ‘bought’ by those living on the land, it is leased for 99 years. With rapid urbanisation the traditional leaders just take the land back. Middle income families are pushing subsistence farmers out of their land. Some farmers are changing lively hoods to construction.
Strong cultural links to the land they farm on are broken due to middle class bloat to the peri-urban region. Growth in middle income flats, many migrants to the city are middle income citizens, following attending Kumasi university the students tend to settle in the city.
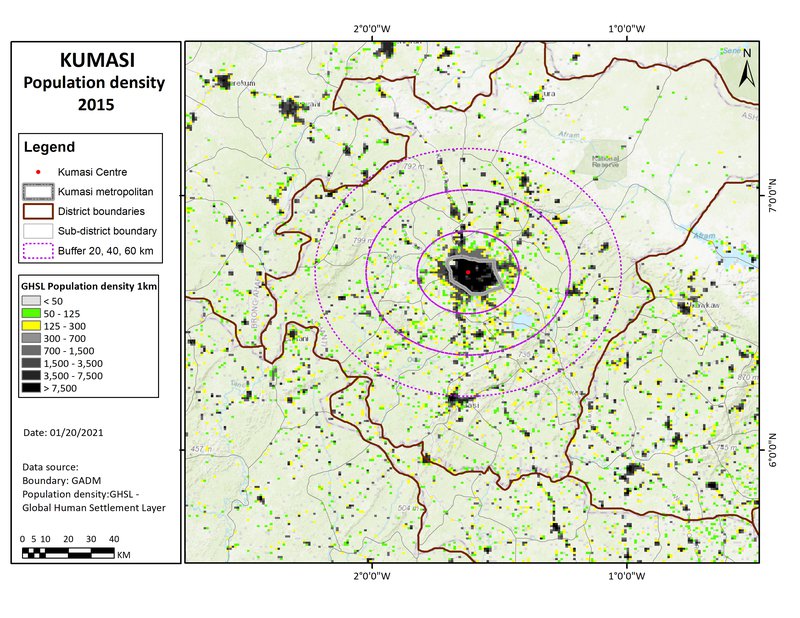
Kumasi region
(The map here shows circles of 20, 40 & 60km radius, a rough approximation to the gravity field).
Kumasi region: overview
Kumasi is a fast developing West African city set in a fertile landscape, with impending climate stress from extreme heat, storm & ecosystems change:
Peri-urban syndromes: rapid peri-urban expansion into a complex tropical landscape of forest, pasture & bush: lower-income settlements under pressure from middle/upper-income encroachment: disruption of peri-urban indigenous livelihoods & ecosystems:
Climate change syndromes: growing riverine & flash flooding: water stress, disruption to soil & ecosystems: urban heat island & air pollution: increasing extreme wet heat days: rapid depletion & burning of forest in the hinterland:
Societal vulnerability: rapid transformation of peri-urban communities, rural economies & livelihoods: urbanizing social change & gentrification: disruption to indigenous farming livelihoods, landscape & ecosystems:
Governance syndromes: dual system of customary tribal government & land ownership: widespread political inertia, elite capture, informal economies: little if any climate awareness or policy:
Adaptive pathways: urban-rural linkages for peri-urban livelihoods: agro-ecology & integrated food systems: circular economy livelihoods: grassroots innovations & community resilience:
Adaptive governance: integration of formal / customary governance: strategic climate-wise planning: private sector & market integration: civil society as active institution.
Kumasi region: where is the peri-urban?
Kumasi region: system mapping
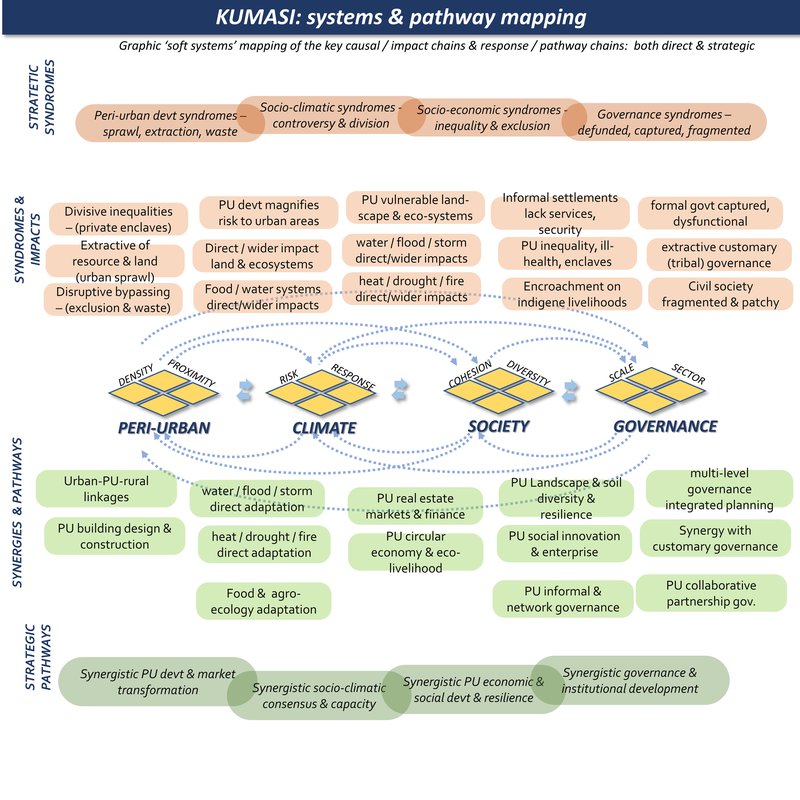
Huge diversity of faith groups and informal community networks. African cities are largely informal, 80% of economic activities is informal, of 80% of land ownership is informal as owned by tribal leaders.
Kumasi is seen as the ‘seat of the king’: conflict between traditional ‘customary’ authority & modern administration. In reality traditional leaders are determining land use due to a weak planning system. Currently tribal leaders own 80% of the land.
Informal housing development occurs across Kumasi, in locations lacking infrastructure (water, electricity, roads). First housing is built, then access to infrastructure is considered.
People buy land and develop it before they have sought permission from planning authority. Land is bought from traditional owner. Traditional or tribal leaders need to work with new planning systems: the power struggle results in the informal development of Kumasi.
Kumasi region: summary data
CLIMATE HAZARD
(World Bank data for Ashanti province)
Extreme heat - Medium
Wildfire - High
Water scarcity - Medium
River flood - High
Urban flood - High
Coastal flood - No data
Cyclone - No data
Tsunami - No data
Landslide - Low
Earthquake - Medium
Volcano - No data
Population density map
This shows three population density bands: 0-50, 50-125, and 125-300 persons/km2: (transparent for open land, and then green and yellow cells). These are in different proximities to the main urban centres, for the moment defined by distances (from the urban centre), of 0-20, 20-40, and 40-60km: titled 'near-urban', 'near-urban: further urban: and ex-urban / peri-rural'.
Climate projections: temperature effects
(Top & middle parts include):
- temperature uplift and precipitation uplift, projected with the central ‘A1B’ scenario, for 2080-2100. Source: IPCC - AR4 - WG1 - Chapter 11-1 - https://www.ipcc.ch/site/assets/uploads/2018/02/ar4-wg1-chapter11-1.pdf
(Lower part includes):
- Comparison of projected temperature rise under B1, A1B, A2 emissions scenarios: Source - IPCC - AR4 - WG1 - Chapter 11-1
- Peak wet bulb temperatures 1979-2017: (note TW of 30-350 can be lethal). Source : https://research.noaa.gov/article/ArtMID/587/ArticleID/2621/Dangerous-humid-heat-extremes-occurring-decades-before-expected
- Fire (2020 summer period) & forest cover maps (>30% canopy cover): Source https://www.globalforestwatch.org
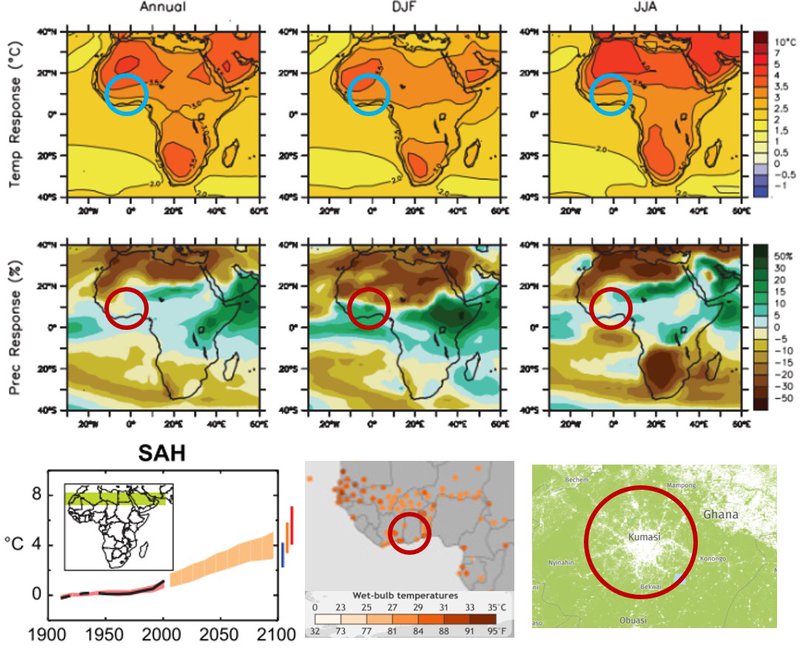
Sources:
IPCC-WG1 2016
NOAA
Global Forest Watch