Santiago region: location
Santiago
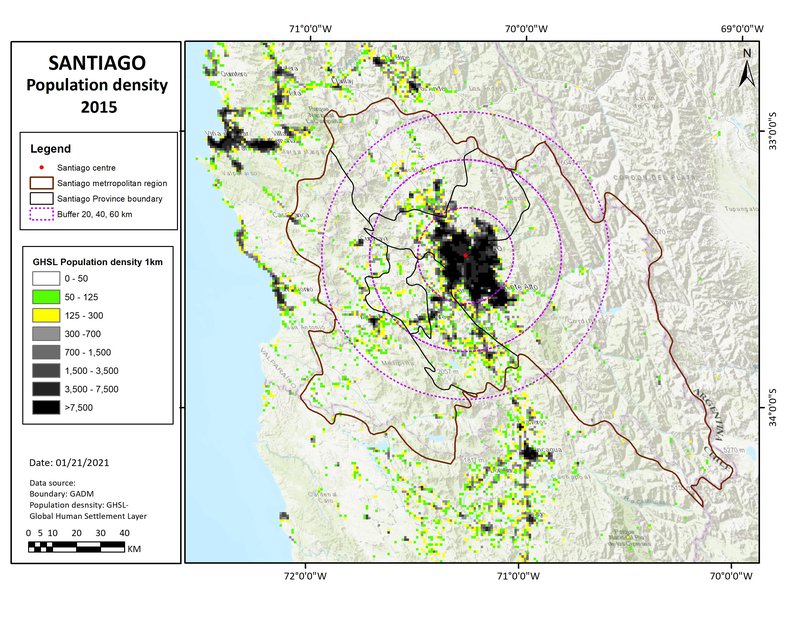
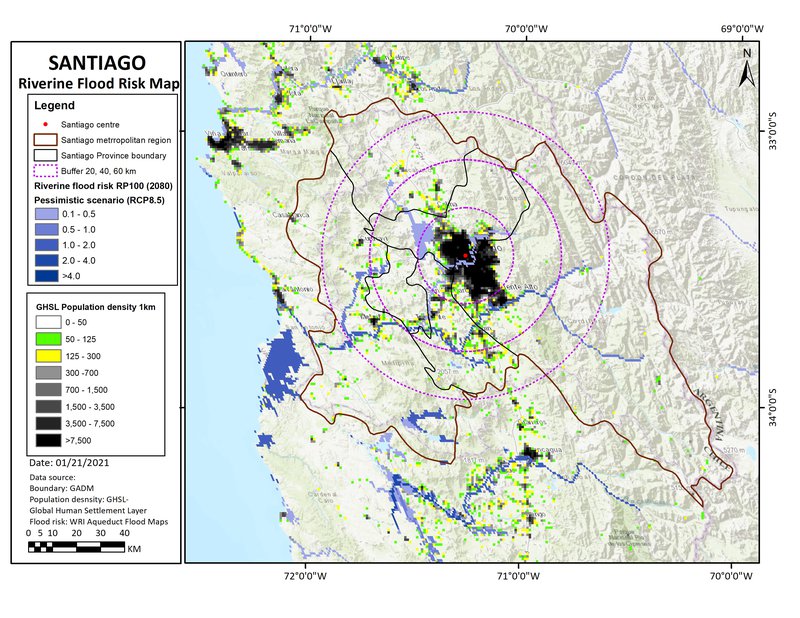
(The map here shows circles of 20, 40 & 60km radius, a rough approximation to the gravity field).
Santiago region: overview
Santiago is a post-industrial city expanding into complex fragile landscape: climate risks of heat, drought, flood from upstream mountain area: climate risks are overlaid on seismic risks & on patterns of peri-urban growth, decline & gentrification.
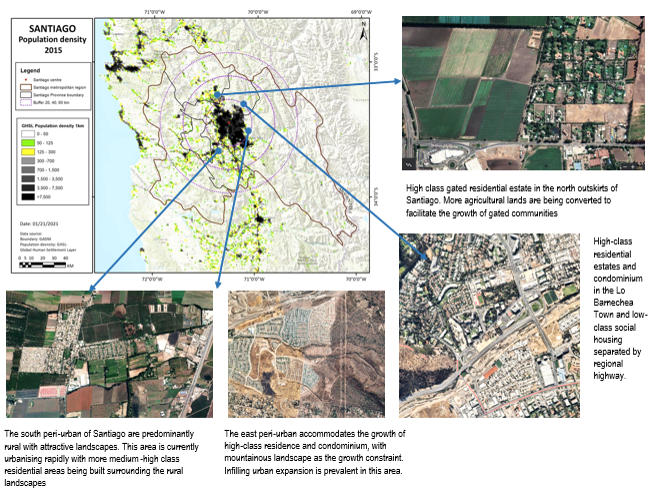
Peri-urban syndromes: a formerly compact city with planned public housing is now expanding with higher-value enclave settlements, along with expansion of traditional towns, dispersed peri-urban development, & rural change in the hinterland.
Climate change risks: seasonal rivers are prone to flooding in low lying areas: sea level rise on low-lying coast: rapid increase in forest fires in drought & heat conditions, with desertification & rapid depletion of tree cover: indirect impacts on ecosystems & farmland:
Societal vulnerability: former cultivation systems fall obsolete in arid conditions, with disruption & loss of livelihoods: housing stress / economic vulnerability in peri-urban / peri-rural settlements, with tensions from decline & gentrification:
Governance syndromes: government & public services are in flux with new political change, meanwhile there is typical elite capture & fragmentation: active civil society lacks connections: peri-urban development & climate awareness not yet mainstream:
Adaptive pathways: urban-rural linkages with agro-ecology systems, new forms of land stewardship, circular economy livelihoods: climate-wise development patterns: market potential for eco-real estate: integrated water / drought / heat resilience:
Adaptive governance: policy integration & capacity building for multi-level government: new role for collaborative-associative civil society governance: potential for grassroots / social innovations.
Santiago region: where is the peri-urban?
Scope: the Santiago Province and Metropolitan Region is at the centre: the 200km frame also includes the Andes and Chilean Coast Range.
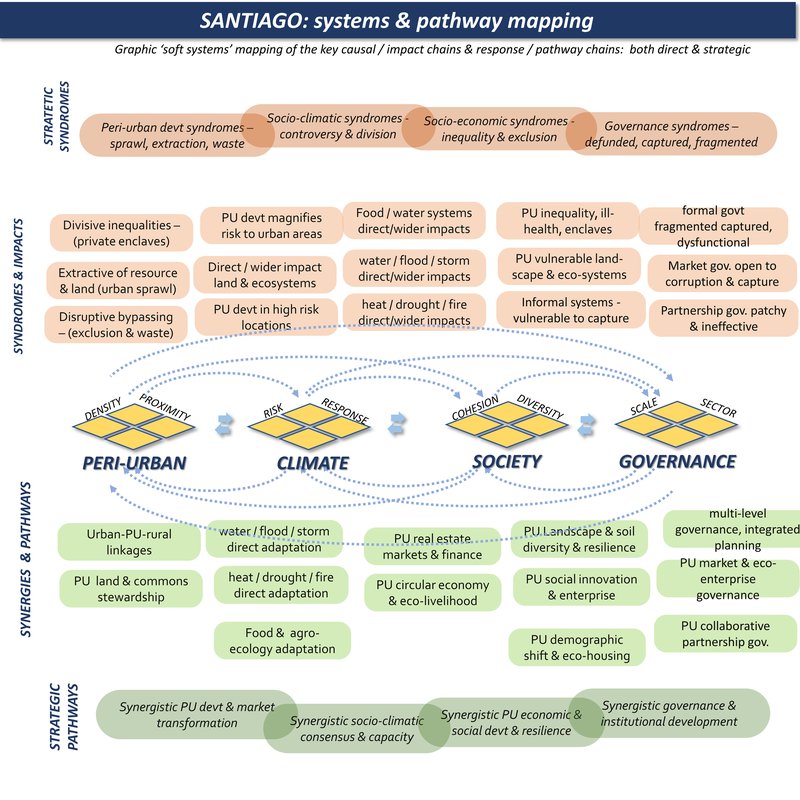
Santiago region: system mapping
Santiago region: summary data
Climate hazard
(World Bank data profile for Santiago)
Extreme heat - Low
Wildfire - High
Water scarcity - High
River flood - Low
Urban flood - Low
Coastal flood - No data
Cyclone - No data
Tsunami - No data
Landslide - High
Earthquake - High
Volcano - Low
Population density map
This shows three population density bands: 0-50, 50-125, and 125-300 persons/km2: (transparent for open land, and then green and yellow cells). These are in different proximities to the main urban centres, for the moment defined by distances (from the urban centre), of 0-20, 20-40, and 40-60km: titled 'near-urban', 'near-urban: further urban: and ex-urban / peri-rural'.
Climate projections: river flooding
Including river flooding and related extreme events, this is a ‘reasonable worst case scenario’ for 2080, with reduced policy and pessimistic modelling. This is based on the mapping from https://www.wri.org/resources/maps/aqueduct-global-flood-analyzer
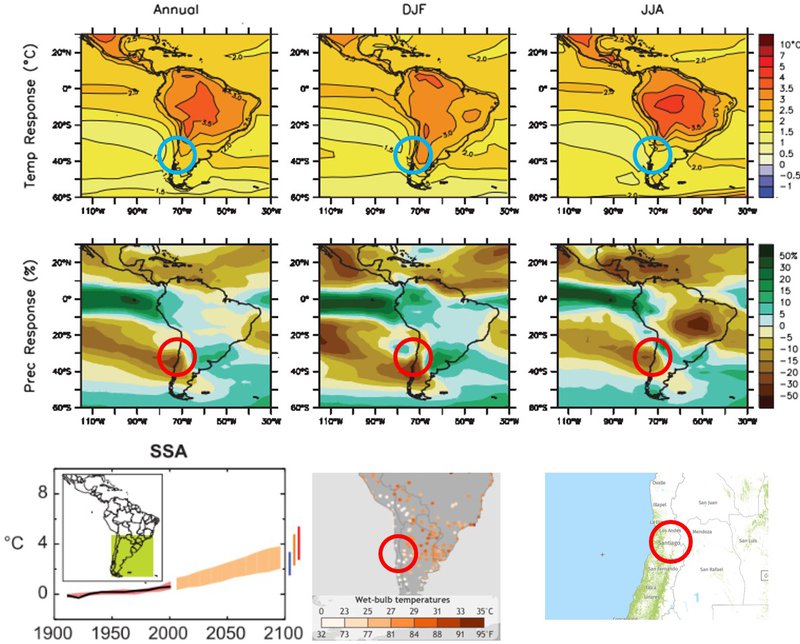
Climate projections: temperature effects
(Top & middle parts include):
- temperature uplift and precipitation uplift, projected with the central ‘A1B’ scenario, for 2080-2100. Source: IPCC - AR4 - WG1 - Chapter 11-1 - https://www.ipcc.ch/site/assets/uploads/2018/02/ar4-wg1-chapter11-1.pdf
(Lower part includes):
- Comparison of projected temperature rise under B1, A1B, A2 emissions scenarios: Source - IPCC - AR4 - WG1 - Chapter 11-1
- Peak wet bulb temperatures 1979-2017: (note TW of 30-350 can be lethal). Source : https://research.noaa.gov/article/ArtMID/587/ArticleID/2621/Dangerous-humid-heat-extremes-occurring-decades-before-expected
- Fire (2020 summer period) & forest cover maps (>30% canopy cover): Source https://www.globalforestwatch.org