Mexicali region: location
Mexicali region
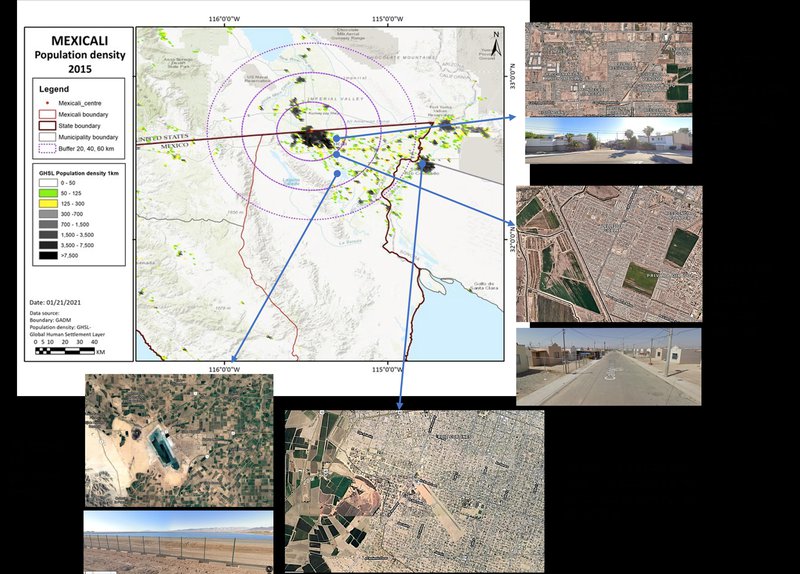
Mexicali region: overview
Mexicali is a border city with a historic role in the economy of Imperial Valley California, in a desert scrub landscape overlaid with water-intensive agriculture: high dependency on Colorado river on USA side, with extreme heat drought & water stress projected.
Peri-urban syndromes: extensive car-based grid pattern city expanding adhoc into peri-urban areas, with higher value enclaves & lower-value housing: most new population is urban higher density, with smaller peri-urban developments: most hinterland is uninhabited desert.
Climate change risks: extreme heat & water stress is projected, with near total dependency on Colorado river water coming from USA western states. urban heat island. Occasional riverine & flash flooding, lacking water management: with rapid loss of remaining tree cover.
Societal vulnerability: water-intensive / industrial high input cultivation, with migrant farm workers in very poor conditions: economic vulnerability in peri-urban / peri-rural settlements: refugees from climate / conflict arriving from the south:
Governance syndromes: government & public services in flux between state & national anti-corruption programs, overlaid on widespread local elite capture: civil society & grassroots generally excluded: peri-urban & climate awareness not yet on the agenda:
Adaptive pathways: integrated planning & design for climate-wise water / drought / heat resilience: urban-rural linkages with agro-ecology systems, circular economy livelihoods: potential for eco-real estate markets & climate-wise development patterns:
Adaptive governance: policy integration & capacity building for multi-level government: new role for civil society governance: potential for grassroots / social innovations.
Mexicali region: where is the peri-urban?
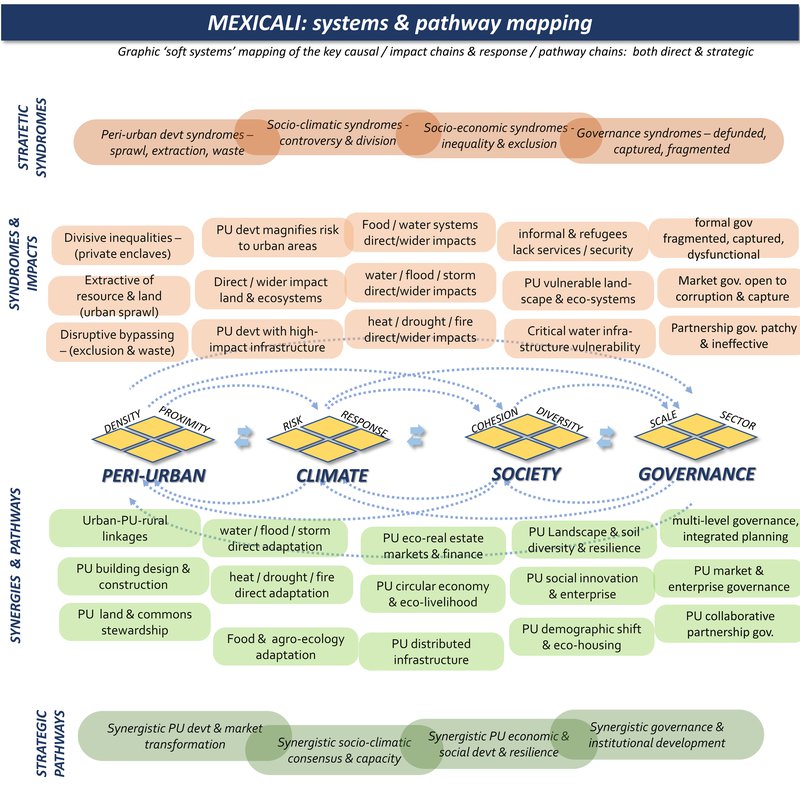
Mexicali region: system mapping
Mexicali region: summary data
Climate hazard
(World Bank data profile for Mexicali)
Extreme heat - High
Wildfire - High
Water scarcity - High
River flood - High
Urban flood - High
Coastal flood - High
Cyclone - Medium
Tsunami - Low
Landslide - Medium
Earthquake - Medium
Volcano - Medium
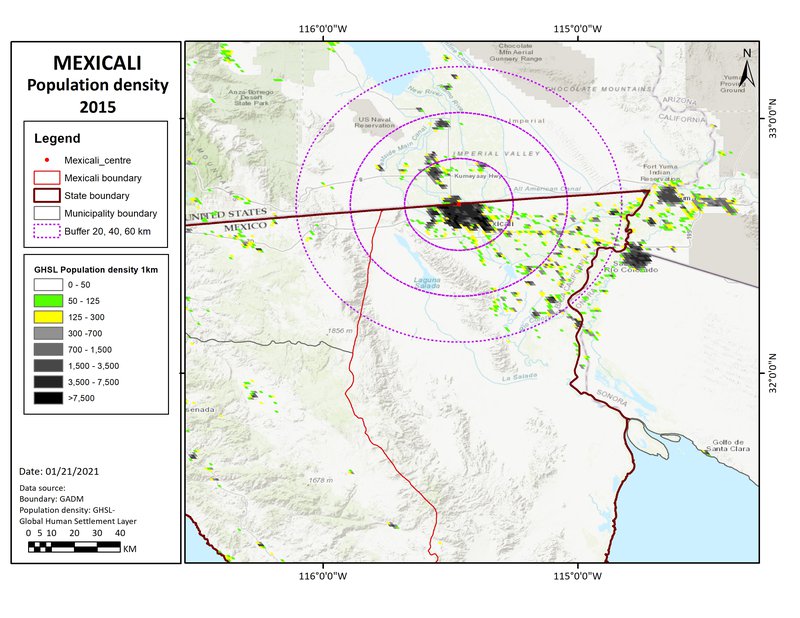
Population density map
This shows three population density bands: 0-50, 50-125, and 125-300 persons/km2: (transparent for open land, and then green and yellow cells). These are in different proximities to the main urban centres, for the moment defined by distances (from the urban centre), of 0-20, 20-40, and 40-60km: titled 'near-urban', 'near-urban: further urban: and ex-urban / peri-rural'.
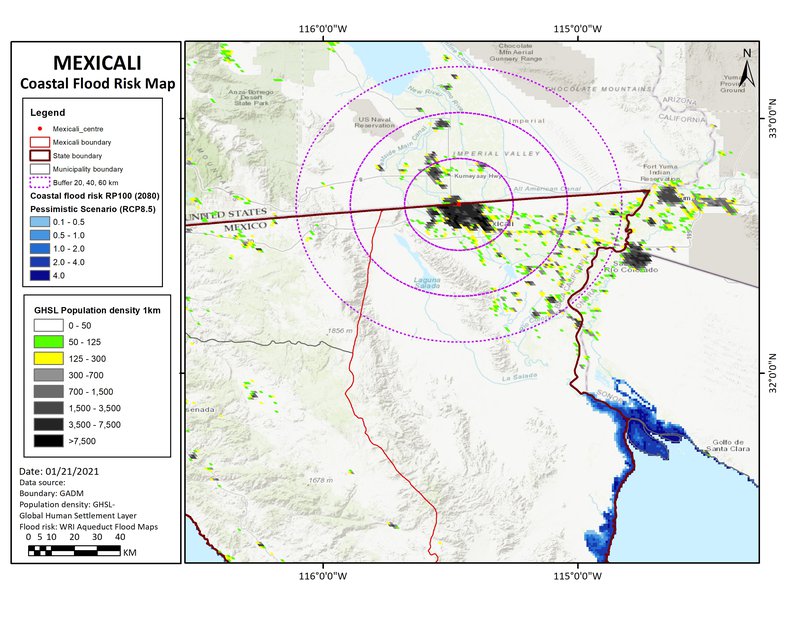
Climate projections: coastal flooding
Including sea level rise, tidal, and storm surge effects, this is a 'reasonable worst case scenario' for 2080, with reduced policy and pessimistic modelling. This is based on the mapping from www.climate-central.org
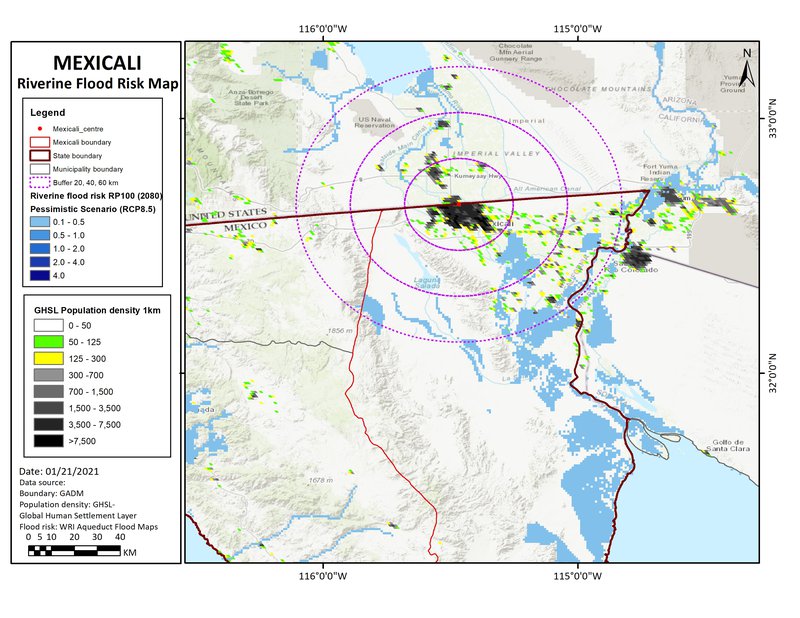
Climate projections: river flooding
Including river flooding and related extreme events, this is a ‘reasonable worst case scenario’ for 2080, with reduced policy and pessimistic modelling. This is based on the mapping from https://www.wri.org/resources/maps/aqueduct-global-flood-analyzer
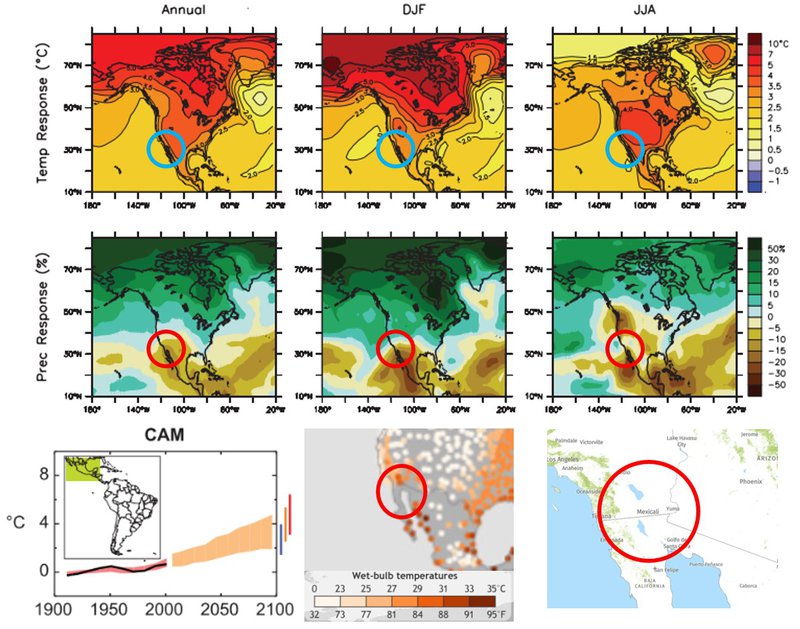
Climate projections: temperature effects
Top six images show annual, summer, and winter temperature, and precipitation changes. Bottom left shows projected temperature changes for a range of scenarios by 2100. Centre bottom shows daily temperature events within the top 0.1% recorded local temperatures from 1979 to 2017. Bottom right shows the 2010 forest cover.
Sources:
IPCC-WG1 2016
NOAA
Global Forest Watch