Surabaya region
(The map here shows circles of 20, 40 & 60km radius, a rough approximation to the gravity field).
Surabaya region: overview
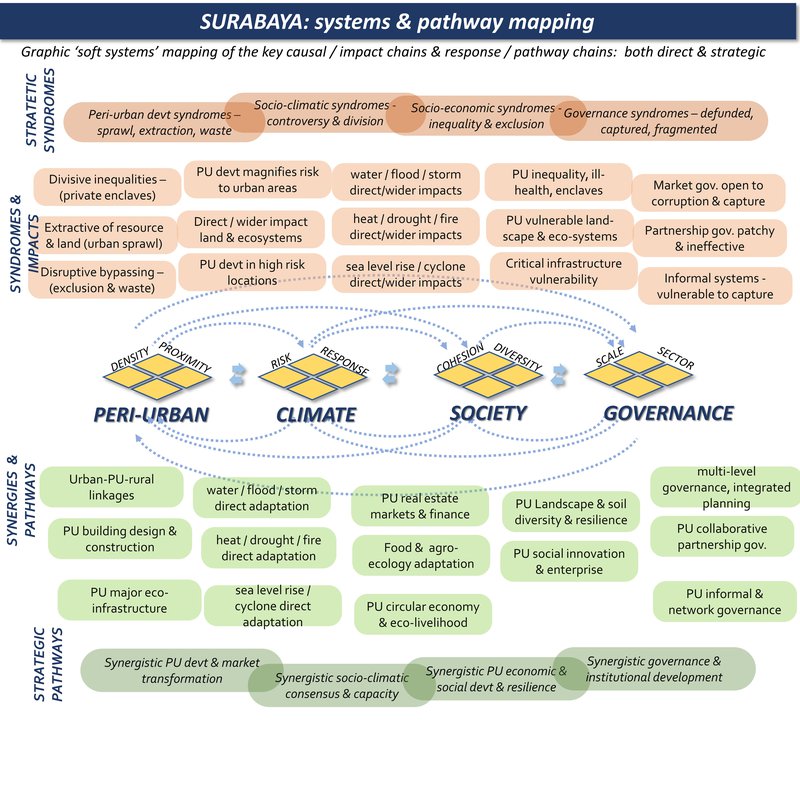
Peri-urban syndromes: rapid urban sprawl into landscape patterns of broad river valleys with forested mountains: disruption of ecosystems & rural livelihoods: development & infrastructure in high risk locations:
Climate change syndromes: riverine flood, storms, landslides: sea level rise & incursion: loss of forest, soil & ecosystems: displacement of flood to urban areas: increasing extreme wet heat days:
Societal vulnerability: disruption to livelihoods & farming & rural communities: social change & gentrification: suburban exclusion & privatization:
Governance syndromes: economic devt pressures: institutional silos & fragmentation: post colonial legacies: climate awareness & capacity is lacking:
Adaptive pathways: urban-rural linkages for food, ecosystems, livelihoods: circular economy principles: integrated water management & multi-functional landuse: climate-wise peri-urban devt.
Adaptive governance: regional strategic climate-wise planning: civil society governance: socio-climatic integration: managing private sector interests.
Surabaya region: where is the peri-urban?
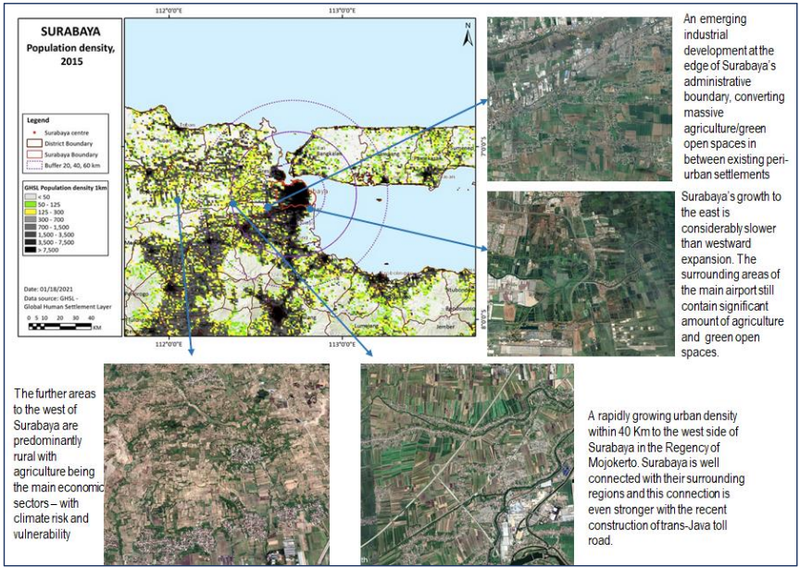
Population density map
This shows three population density bands: 0-50, 50-125, and 125-300 persons/km2: (transparent for open land, and then green and yellow cells). These are in different proximities to the main urban centres, for the moment defined by distances (from the urban centre), of 0-20, 20-40, and 40-60km: titled 'near-urban', 'near-urban: further urban: and ex-urban / peri-rural'.
Surabaya region: system mapping
Surabaya region: summary data
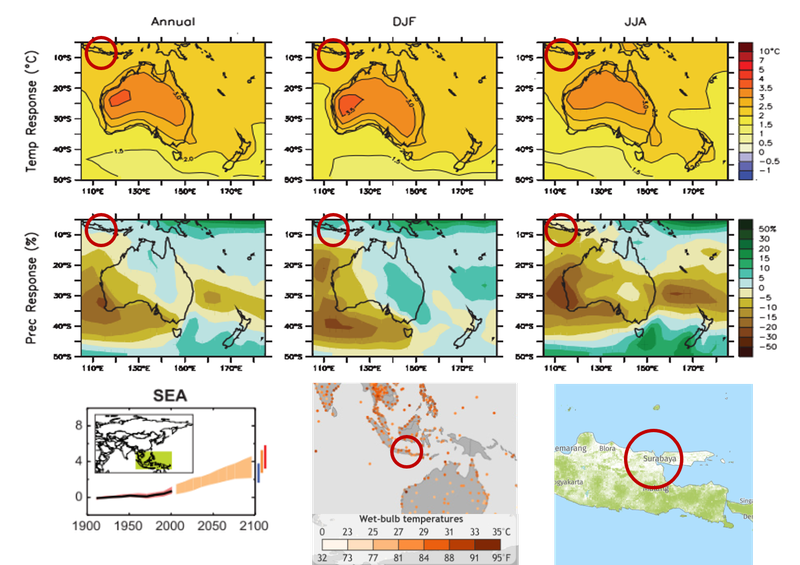
Climate projections: temperature effects
Top six images show annual, summer, and winter temperature, and precipitation changes. Bottom left shows projected temperature changes for a range of scenarios by 2100. Centre bottom shows daily temperature events within the top 0.1% recorded local temperatures from 1979 to 2017. Bottom right shows the 2010 forest cover.
Causal analysis
This puts the mapping above into an analytic for with a summary table. For more see the Surabaya analysis:
(In advance of consultation this version is a comparison of our two detailed case studies).
Climate hazard
(World bank data profile for Surabaya)
Extreme heat - Medium
Wildfire - High
Water scarcity - Medium
River flood - Medium
Urban flood - Medium
Coastal flood - High
Cyclone - No data
Tsunami - Medium
Landslide - Very low
Earthquake - Medium
Volcano - High