Granada region: Location
Granada
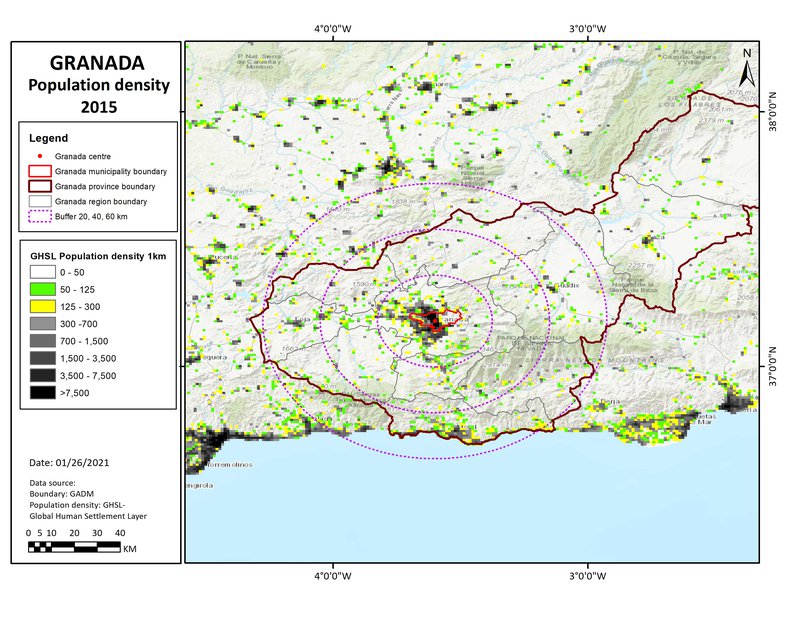
(The map here shows circles of 20, 40 & 60km radius, a rough approximation to the gravity field).
Granada region: Overview
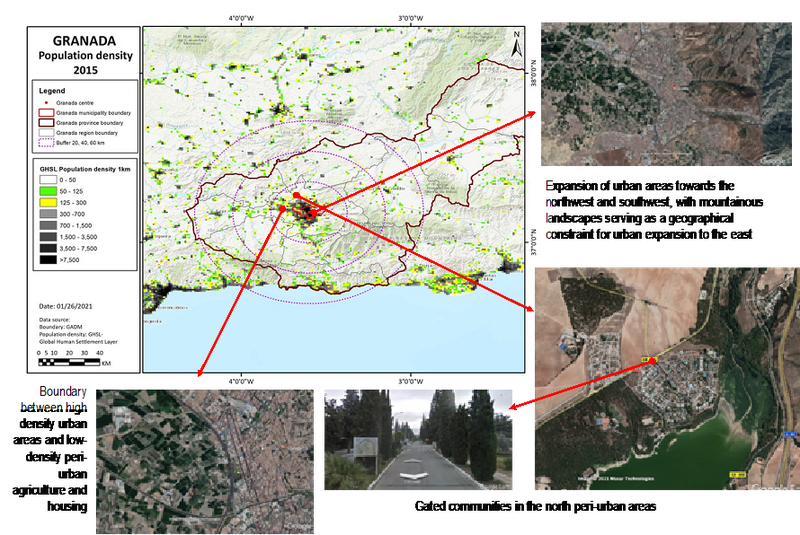
Granada is a historic city-region of 1 million, in a fertile valley with mountainous surroundings: around 60km from the coastal strip of Malaga with intensive tourist and economic development. There is increasing drought, heat, fire & occasional flooding, overlaid on fragile landscape, still losing its remaining tree cover:
Peri-urban syndromes: outward movement into peri-urban hinterland along river valleys: Ongoing gentrification of rural settlements in further hinterland: much new development is high risk locations.
Climate change risks: seasonal rivers are prone to flooding in low lying areas: limited sea level rise on coast: projected extreme heat & drought in Mediterranean basin, with water stress, desertification & forest fires: indirect impacts on ecosystems & farmland:
Societal vulnerability: ongoing landscape deterioration in arid conditions, historic cultivation systems are obsolete, continuing forest loss: housing stress / economic vulnerability in peri-urban / peri-rural settlements, general vulnerability of ageing & low-income populations.
Governance syndromes: government & public services are under-funded, fragmented & struggle with elite capture: active civil society lacks connections: growing climate awareness but policy still catching up:
Adaptive pathways: urban-rural linkages with agro-ecology, stewardship of land & ecosystems, circular economy livelihoods: climate-wise development patterns & forms: integrated water / drought / heat resilience:
Adaptive governance: policy integration & capacity building for multi-level government: new role for collaborative-associative civil society governance.
Granada region: where is the peri-urban?
Scope: a wider region surrounding Granada: (a) a post-agrarian
region in a semi-arid mountain landscape: and (b) coastal strip with
rapid tourist & industrial development.
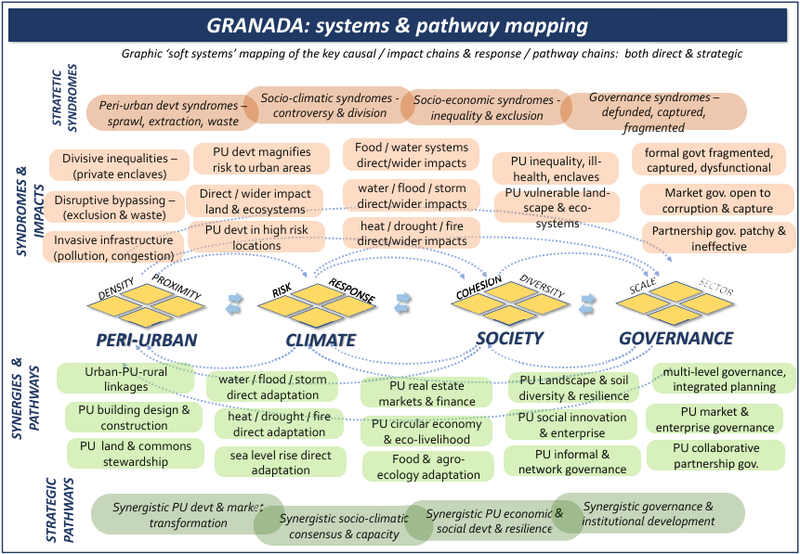
Granada region: systems mapping
Using visual thinking for the deeper complexity of peri-urban-climate interactions, here are 2 images. The first is a flip-chart sketch and overview of the problem. The second is a ‘Causal mapping’ from the Peri-cene Framework, with basic problems and pathways. For more see the Granada pathways.
Population density map
This shows three population density bands: 0-50, 50-125, and 125-300 persons/km2: (transparent for open land, and then green and yellow cells). These are in different proximities to the main urban centres, for the moment defined by distances (from the urban centre), of 0-20, 20-40, and 40-60km: titled 'near-urban', 'near-urban: further urban: and ex-urban / peri-rural'.
Granada region: summary data
This puts the mapping above into an analytic for with a summary table. For more see the Granada problems
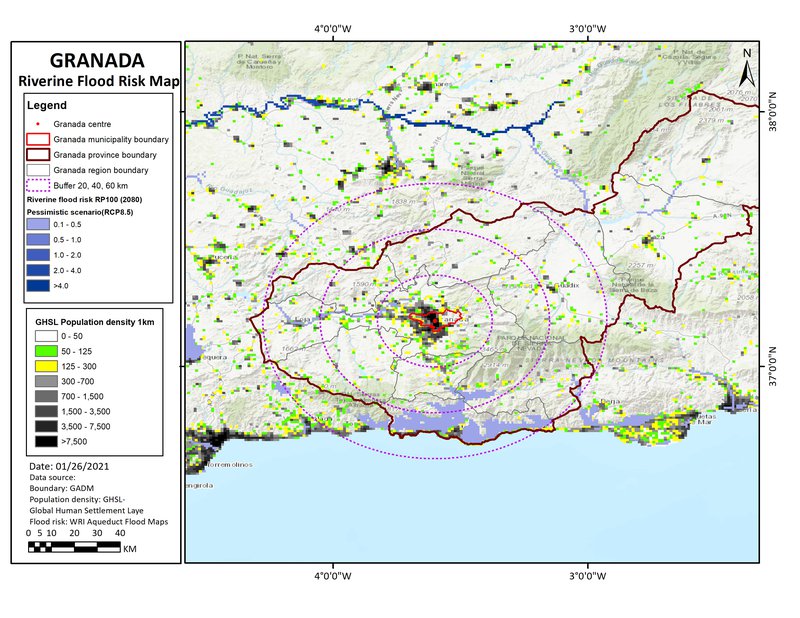
Climate projections: river flooding
Including river flooding and related extreme events, this is a ‘reasonable worst case scenario’ for 2080, with reduced policy and pessimistic modelling. This is based on the mapping from https://www.wri.org/resources/maps/aqueduct-global-flood-analyzer.
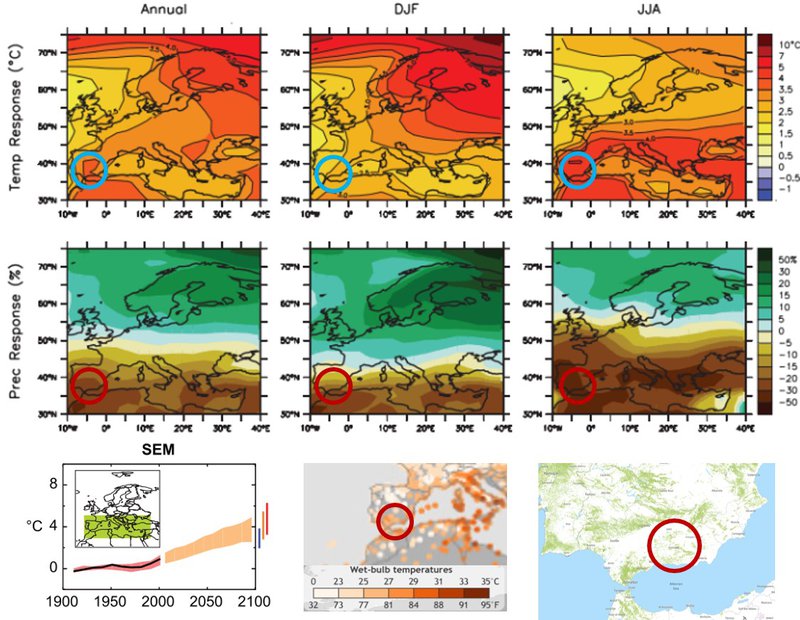
Climate projections: temperature effects
(Top & middle parts include):
- temperature uplift and precipitation uplift, projected with the central ‘A1B’ scenario, for 2080-2100. Source: IPCC - AR4 - WG1 - Chapter 11-1 - https://www.ipcc.ch/site/assets/uploads/2018/02/ar4-wg1-chapter11-1.pdf
(Lower part includes):
- Comparison of projected temperature rise under B1, A1B, A2 emissions scenarios: Source - IPCC - AR4 - WG1 - Chapter 11-1
- Peak wet bulb temperatures 1979-2017: (note TW of 30-350 can be lethal). Source : https://research.noaa.gov/article/ArtMID/587/ArticleID/2621/Dangerous-humid-heat-extremes-occurring-decades-before-expected
- Fire (2020 summer period) & forest cover maps (>30% canopy cover): Source https://www.globalforestwatch.org
Climate hazard
(World Bank data profile for Granada region)
Extreme heat - Medium
Wildfire - High
Water scarcity - Medium
River flood - Very low
Urban flood - Low
Coastal flood - Very low
Cyclone - No data
Tsunami - Low
Landslide - Medium
Earthquake - Medium
Volcano - No data