Helsinki region: location
Helsinki
(The map here shows circles of 20, 40 & 60km radius, a rough approximation to the gravity field).
Helsinki region: overview
Peri-urban syndromes: gradual metropolitan expansion towards planned extensions & satellites on growth corridors: some gentrification & rural decline in further hinterland: rural summer cabins & some housing development in high risk locations:
Climate change risks: growing risk of riverine flooding in low lying areas: limited sea level rise: increasing drought & forest fire: indirect impacts on ecosystems & invasive species:
Societal vulnerability: growing fragility of forest / lake landscape & ecosystems: rural livelihoods in transition: generally high social cohesion but some tensions & divisions from social change:
Governance syndromes: government institutions are effective but in sectoral silos with multi-level tension: functioning civil society, strong climate awareness & policy, but much diversion and inertia:
Adaptive pathways: integrated water / forestry / ecosystems adaptation: real estate & ecosystems market integration: eco-housing & distributed infrastructure: climate-wise peri-urban development patterns & design:
Adaptive governance: continuing policy integration & multi-level government: collaborative-associative governance with civil society
Helsinki region: where is the peri-urban?
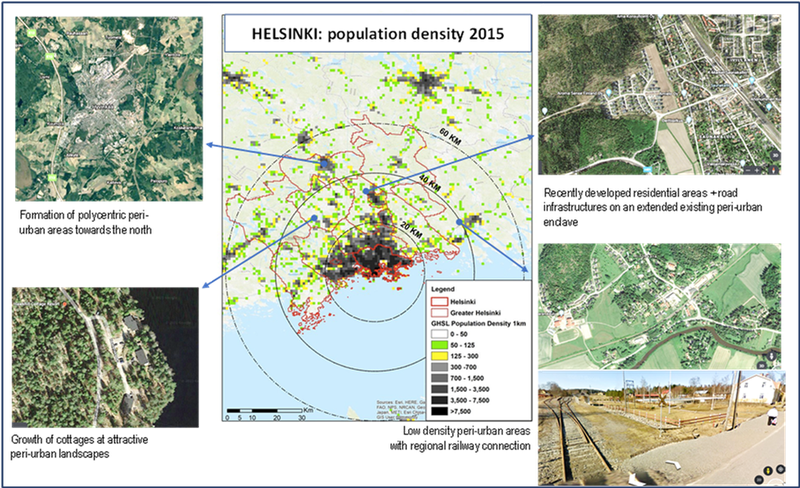
Scope: includes the Greater Helsinki metropolitan region, and its peri-urban / rural landscape of lakes and forests, with smaller / larger towns on strategic corridors.
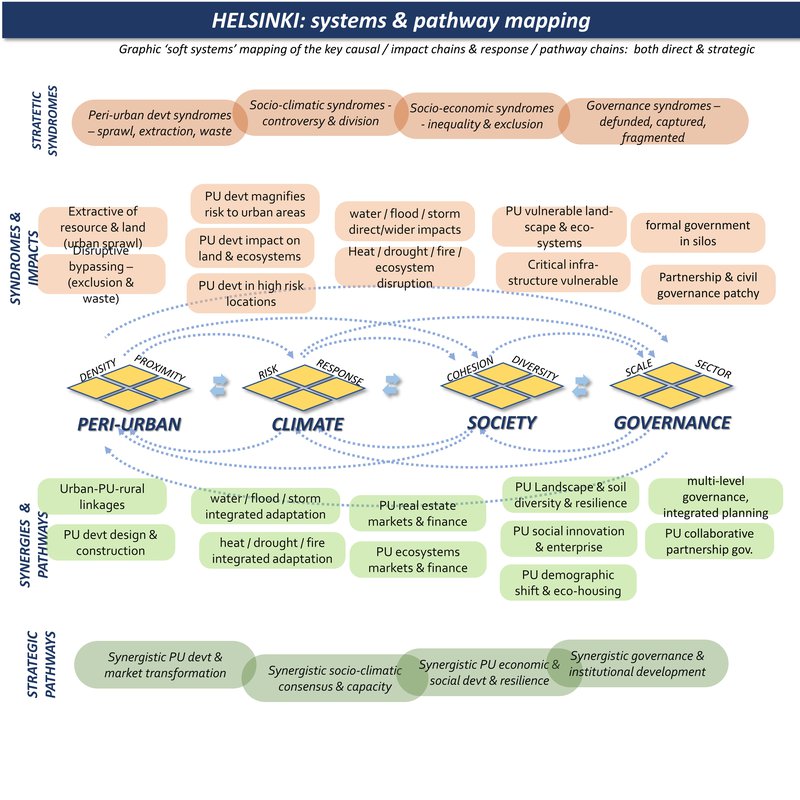
Helsinki region: system mapping
Helsinki region: summary data
Climate hazard
(World Bank data profile for Uusimaa)
Extreme heat - Low
Wildfire - Medium
Water scarcity - Low
River flood - Very low
Urban flood - Very low
Coastal flood - Medium
Cyclone - No data
Tsunami - No data
Landslide - No data
Earthquake - Very low
Volcano - No data
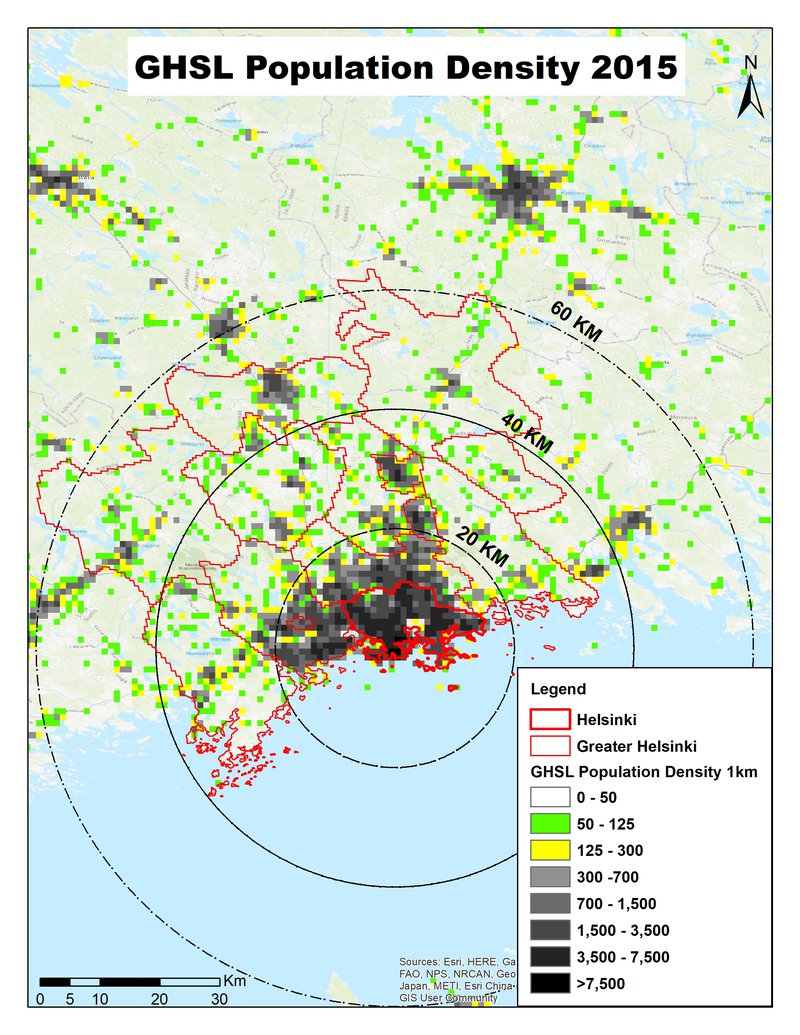
Population density map
This shows three population density bands: 0-50, 50-125, and 125-300 persons/km2: (transparent for open land, and then green and yellow cells). These are in different proximities to the main urban centres, for the moment defined by distances (from the urban centre), of 0-20, 20-40, and 40-60km: titled 'near-urban', 'near-urban: further urban: and ex-urban / peri-rural'.
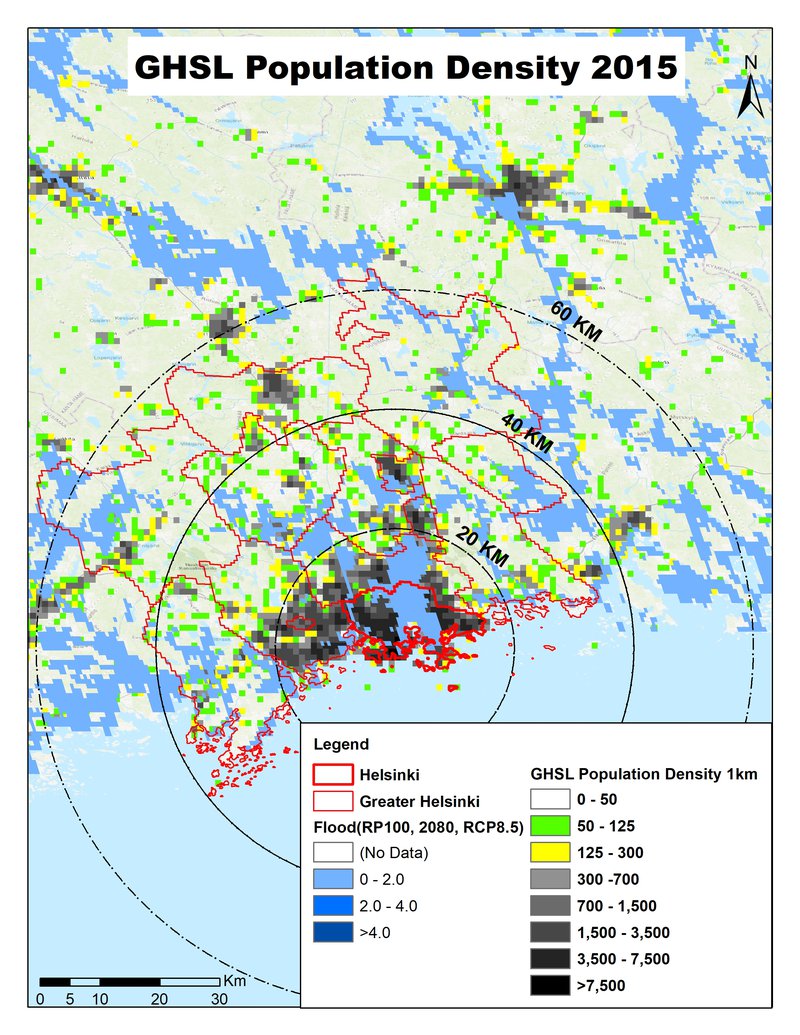
Climate projections: coastal flooding
Including sea level rise, tidal, and storm surge effects, this is a 'reasonable worst case scenario' for 2080, with reduced policy and pessimistic modelling. This is based on the mapping from www.climate-central.org
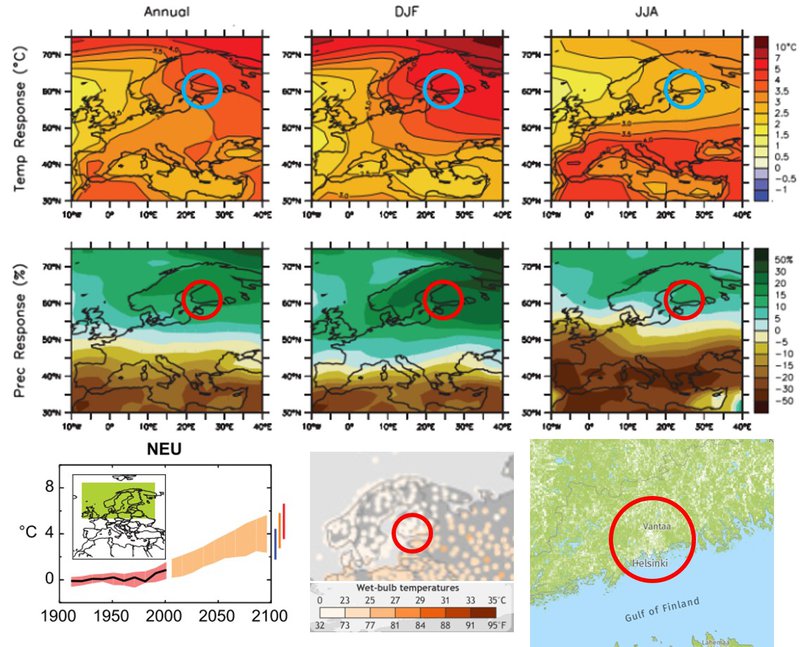
Climate projections: temperature effects
Top six images show annual, summer, and winter temperature, and precipitation changes. Bottom left shows projected temperature changes for a range of scenarios by 2100. Centre bottom shows daily temperature events within the top 0.1% recorded local temperatures from 1979 to 2017. Bottom right shows the 2010 forest cover.
Sources:
IPCC-WG1 2016
NOAA
Global Forest Watch