Greater Melbourne contains 31 municipalities, in an affluent multi-cultural metropolis, doubling in size in 30 years. Large suburban-peri-urban areas are scattered, car dependent, vulnerable to drought and wildfire, and in certain areas river flooding. Social polarization and middle class vulnerability may be on the increase. Peri-rural areas suffer from out-migration, dependency on agriculture and corporate landholdings, declining services. Climate hazards generally include wildfires and all forms of flooding. Coastal areas are at risk from sea level rise and coastal storm hazards on critical infrastructure.
Melbourne region: location
Melbourne region
(The map here shows circles of 20, 40 & 60km radius, a rough approximation to the gravity field).
Melbourne region: overview
Greater Melbourne contains 31 municipalities, in a (generally) affluent multi-cultural metropolis of 4m population, set to double in size in 30 years. Large suburban-peri-urban areas are scattered, car dependent, vulnerable to drought and wildfire, and in certain areas river flooding. Social polarization and middle class vulnerability may be on the increase. Peri-rural areas suffer from out-migration, dependency on agriculture and corporate landholdings, declining services.
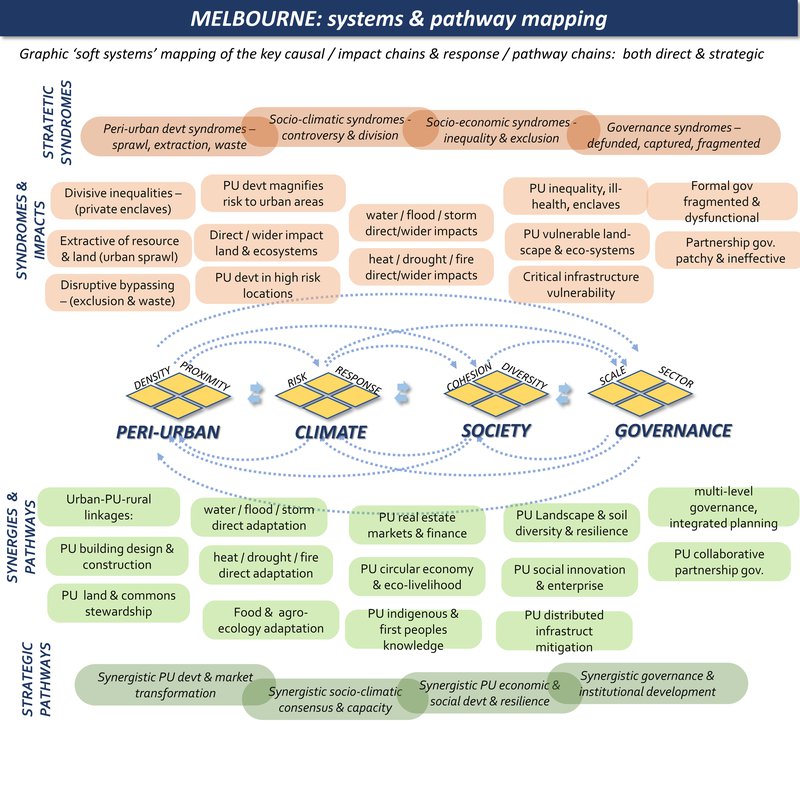
Peri-urban syndromes: low density car based expansion: rural decline & gentrification: livelihood disruption: high risk locations
Climate change syndromes: Climate hazards include wildfires, drought and all forms of flooding. Coastal areas are at risk from sea level rise and coastal storm hazards on critical infrastructure. These will have increasing knock-on effects on farming, peri-urban communities and ecosystems.
Societal vulnerability: fragile landscape & ecosystems: farming in transition : social tensions & divisions: suburban expansion & exclusion:
Governance syndromes: institutional silos & multi-level fragmentation: climate awareness & policy exists but with little capacity to respond:
Adaptive pathways: integrated water management: landscape diversity resilience: multi-functional landuse: traditional owners knowledge: climate-wise peri-urban devt.
Adaptive governance: collaborative-associative governance with civil society: socio-climatic integration:
Melbourne region: where is the peri-urban?
Scope: the frame includes the whole Greater Melbourne boundary which extends to the east. Much of the peri-rural hinterland lies to the west and north. There is a local focus on the town of Ballarat and north west sector.
Body:
Melbourne region: system mapping
For the case study of Ballarat and its area:
- Rapid new urban development, on train line, but a typical 3 hour commute
- Surrounding area of high landscape value, tourist destination, but under climate pressure
- Much housing is buy to rent, for families coming into new affordable housing
- Social fabric & cohesion is often lacking, also public services
- Water is often trucked in
- The new development takes over previous rural farming towns, including older ‘lifestyle’ units of 20+ acres with horse stables.
- Large bushfires were seen in the 1980s
- The bushfires also raise the agenda of the indigenous & traditional owners –
- Not only technical approaches, but human centred social / cultural /psychological approaches seem more effective, in management of fire risk, response & recovery
Climate Hazard
(World Bank data profile for Victoria)
Extreme heat - Medium
Wildfire - High
Water scarcity - Low
River flood - High
Urban flood - High
Coastal flood - High
Cyclone - Low
Tsunami - High
Landslide - Medium
Earthquake - Medium
Volcano - Medium
Spatial mapping
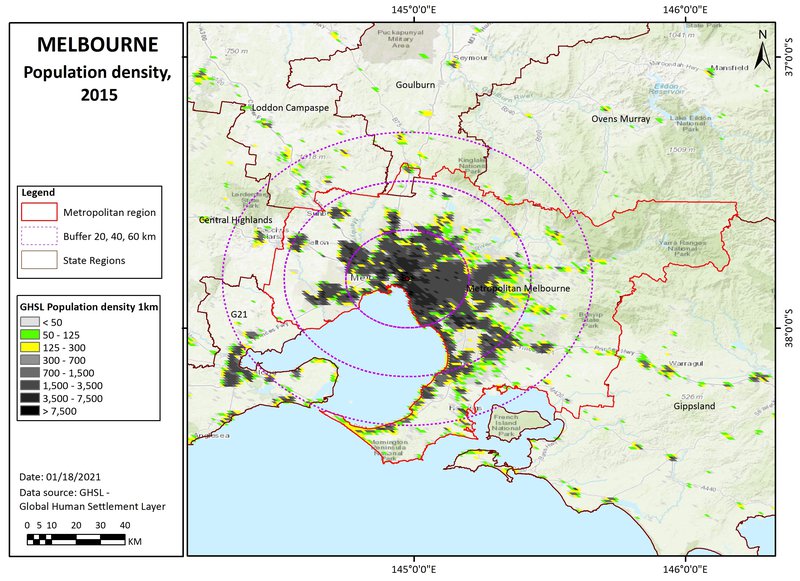
The Peri-cene takes a practical approach to the complexity of peri-urban-climate interactions. The base-maps here build on the JRC-GHSL (Global Human Settlements Layer) system of urban mapping with 1 km2 cells http://ghsl.jrc.ec.europa.eu . In this way the peri-urban definition and mapping is not a final answer, but the start of the discussion. For more on the questions of 'where is the peri-urban?' and 'how is it changing?' download the D3-1 report.
Population density map
This shows three population density bands: 0-50, 50-125, and 125-300 persons/km2: (transparent for open land, and then green and yellow cells). These are in different proximities to the main urban centres, for the moment defined by distances (from the urban centre), of 0-20, 20-40, and 40-60km: titled 'near-urban', 'near-urban: further urban: and ex-urban / peri-rural'.
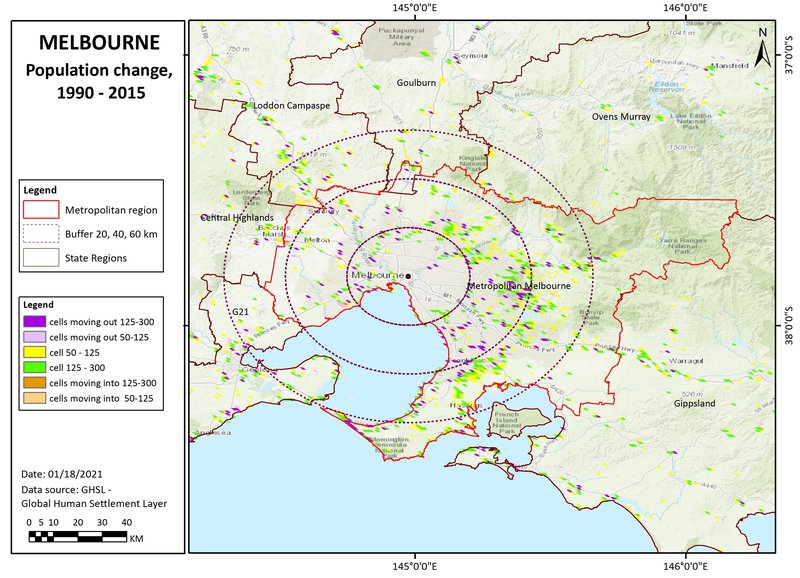
Population change map
This shows the effects of peri-urban change and urban expansion, from 1990 to 2015.
- 'Peri-urbanization': moving from rural to peri-urban
- 'Densification': moving from peri-urban to urban
- 'Urbanization': moving from rural directly to urban
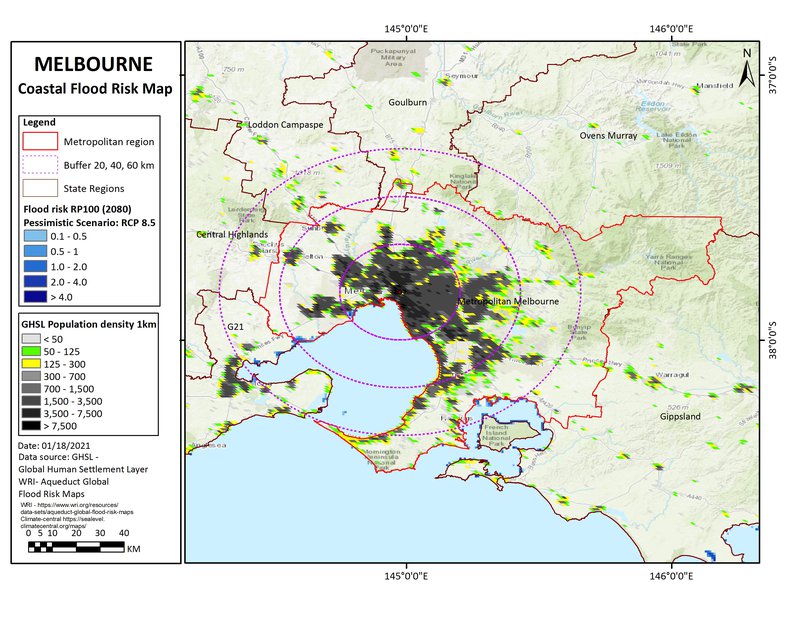
Climate projections: coastal flooding
Including sea level rise, tidal, and storm surge effects, this is a 'reasonable worst case scenario' for 2080, with reduced policy and pessimistic modelling. This is based on the mapping from www.climate-central.org
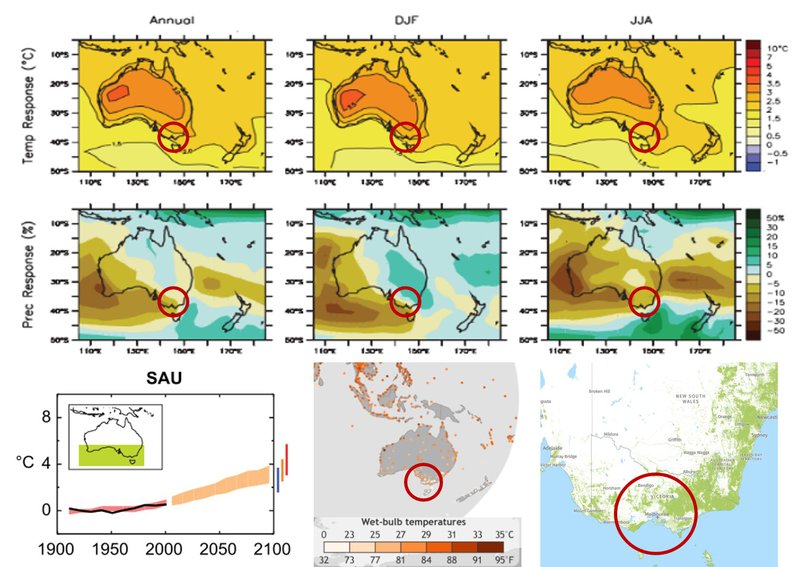
Climate projections: temperature effects
(Top & middle parts include):
- temperature uplift and precipitation uplift, projected with the central ‘A1B’ scenario, for 2080-2100. Source: IPCC - AR4 - WG1 - Chapter 11-1 - https://www.ipcc.ch/site/assets/uploads/2018/02/ar4-wg1-chapter11-1.pdf
(Lower part includes):
- Comparison of projected temperature rise under B1, A1B, A2 emissions scenarios: Source - IPCC - AR4 - WG1 - Chapter 11-1
- Peak wet bulb temperatures 1979-2017: (note TW of 30-350 can be lethal). Source : https://research.noaa.gov/article/ArtMID/587/ArticleID/2621/Dangerous-humid-heat-extremes-occurring-decades-before-expected
- Fire (2020 summer period) & forest cover maps (>30% canopy cover): Source https://www.globalforestwatch.org
Sources:
IPCC-WG1 2016
NOAA
Global Forest Watch