Naples region: location
Naples region
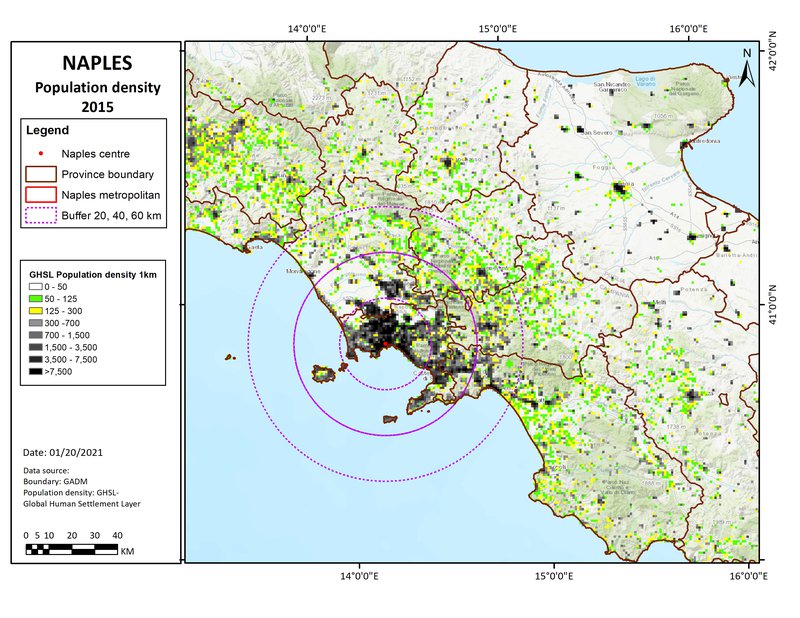
(The map here shows circles of 20, 40 & 60km radius, a rough approximation to the gravity field).
Naples region: overview
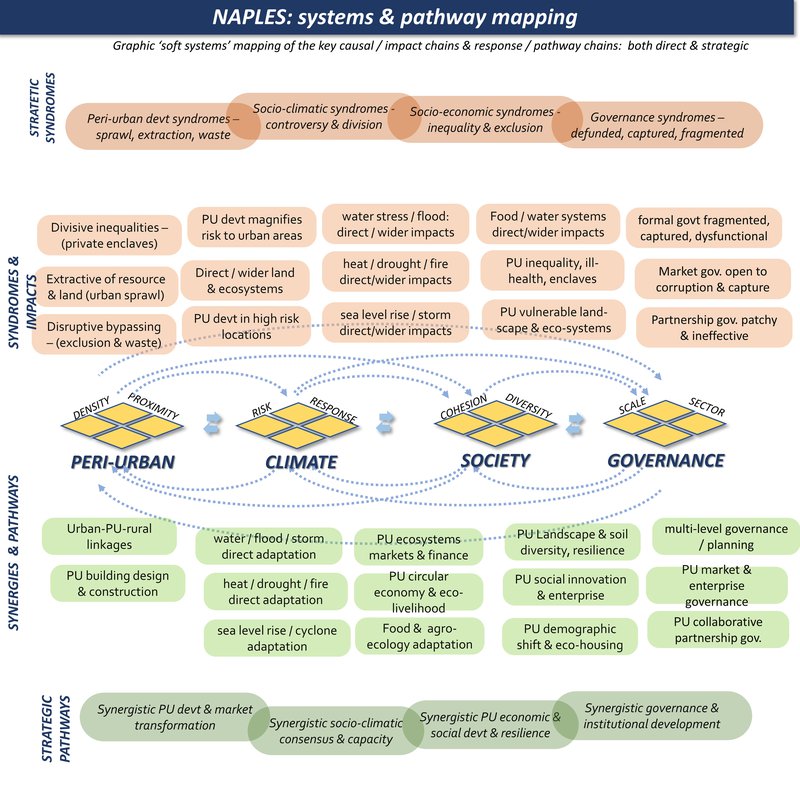
Naples is at the centre of a post-industrial / agrarian region with dense rural areas & slow peri-urbanization, in a complex historic landscape: moderate levels of climate risk: cohesive but fractured society, with dynamic but problematic governance.
Peri-urban syndromes: outward push of the metropolitan area, existing peri-urban patterns in the hinterland are unusually stable over 25 years. Ongoing slow gentrification of rural settlements in further hinterland: much new development is in high risk locations.
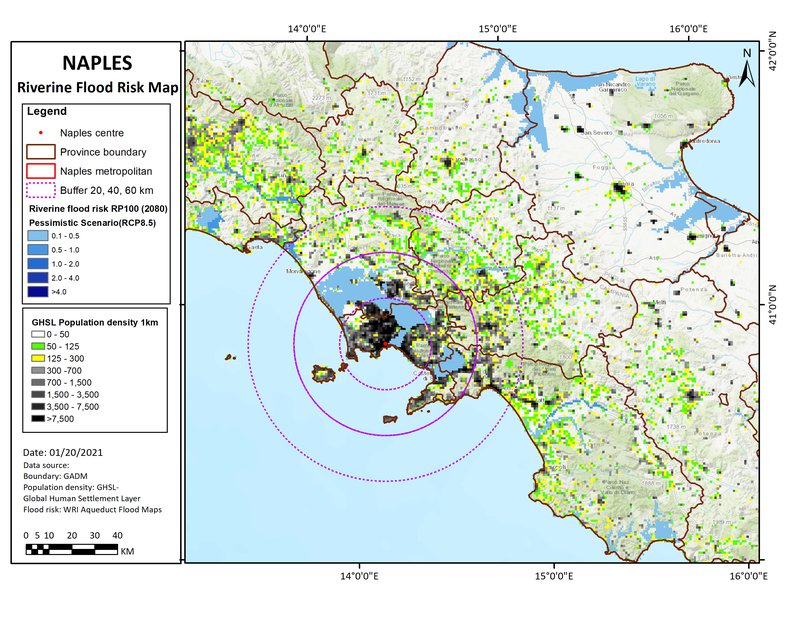
Climate change risks: riverine flooding in low lying areas & river valleys: sea level rise on both coasts: projected extreme heat & drought in Mediterranean basin, with forest fires, desertification & indirect impacts on ecosystems & farmland:
Societal vulnerability: ongoing landscape deterioration & forest loss: social tensions from gentrification & economic vulnerability in post-industrial areas: higher vulnerability to flooding with ageing & low-income populations:
Governance syndromes: government & public services are under-funded, fragmented in silos, pressure from informality & elite capture: active civil society is often not connected: growing climate awareness with policy catching up:
Adaptive pathways: urban-rural linkages with circular economy livelihoods: climate-wise development patterns & forms: ecosystems & real estate market innovations: integrated planning for water / drought / heat resilience: sea level management for low coastal areas:
Adaptive governance: continuing building of capacity & stability for multi-level government: new role for collaborative-associative civil society governance: potential for grassroots social innovations.
Naples region: where is the peri-urban?
Scope: this frame covers most of the Campania region, from the western coastal zone of Naples to the eastern coast on the Adriatic sea.
Naples region: system mapping
Naples region: summary data
Climate hazard
(World Bank data profile for Campania region)
Extreme heat - Medium
Wildfire - High
Water scarcity - Medium
River flood - High
Urban flood - Low
Coastal flood - Medium
Cyclone - No data
Tsunami - Low
Landslide - High
Earthquake - Medium
Volcano - High
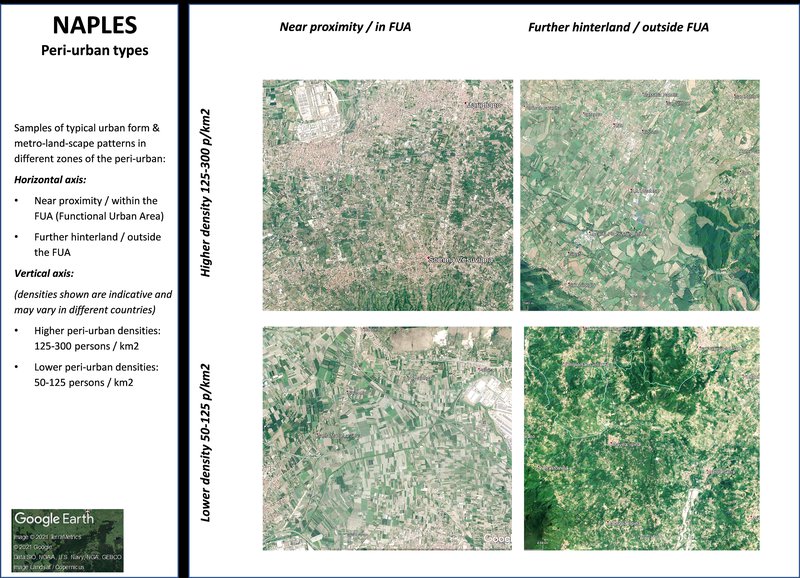
Population density map
This shows three population density bands: 0-50, 50-125, and 125-300 persons/km2: (transparent for open land, and then green and yellow cells). These are in different proximities to the main urban centres, for the moment defined by distances (from the urban centre), of 0-20, 20-40, and 40-60km: titled 'near-urban', 'near-urban: further urban: and ex-urban / peri-rural'.
Climate projections: coastal flooding
Including sea level rise, tidal, and storm surge effects, this is a 'reasonable worst case scenario' for 2080, with reduced policy and pessimistic modelling. This is based on the mapping from www.climate-central.org
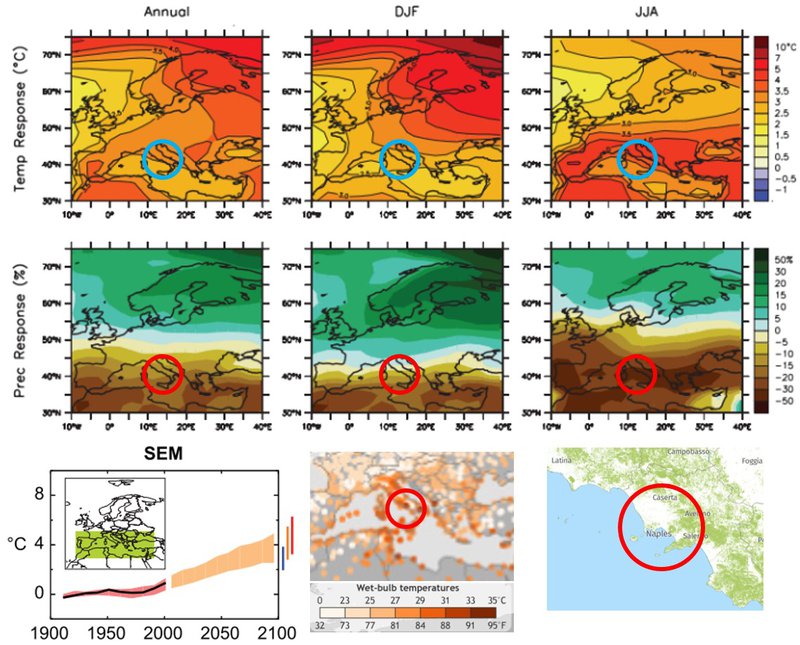
Climate projections: temperature effects
Top six images show annual, summer, and winter temperature, and precipitation changes. Bottom left shows projected temperature changes for a range of scenarios by 2100. Centre bottom shows daily temperature events within the top 0.1% recorded local temperatures from 1979 to 2017. Bottom right shows the 2010 forest cover.
Sources:
IPCC-WG1 2016
NOAA
Global Forest Watch