Toronto region: location
Toronto
(The map here shows circles of 20, 40 & 60km radius, a rough approximation to the gravity field).
Toronto region: overview
Toronto is an affluent expanding metropolis, with a highly protected greenbelt area in a thriving peri-urban hinterland. In this generally managed landscape there are growing climate risks from flooding & heat, with disruption of ecosystems: raising new challenges for a well-ordered governance system.
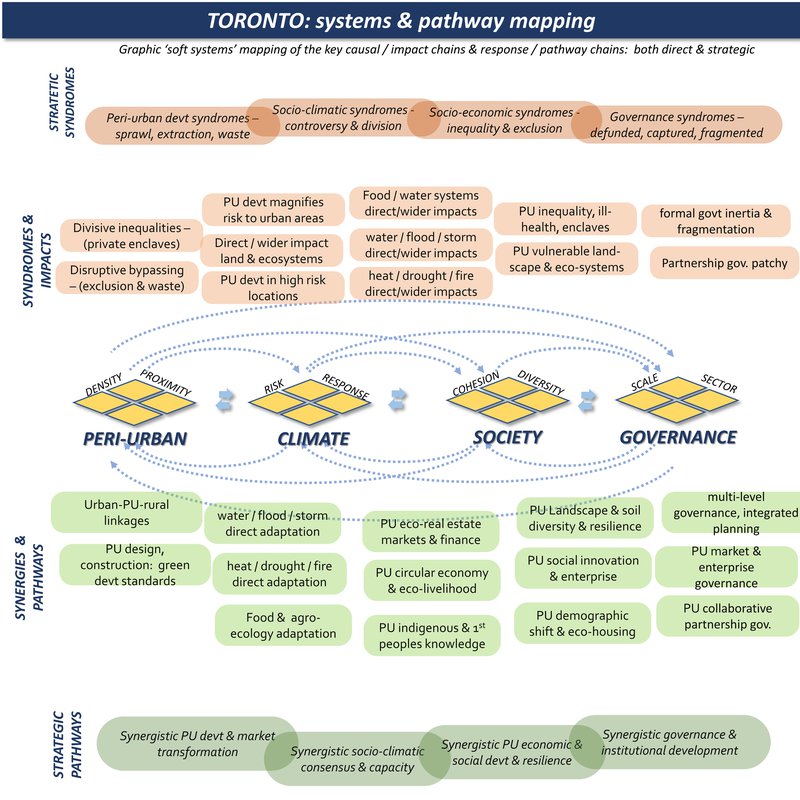
Peri-urban syndromes: Typical N. American suburban development mixed with historic small villages, active farmland, natural areas (conservation areas, parks, forests, wetlands, etc.) Most peri-urban growth is managed in extensions & small towns: some demographic change in farming to commuting. Most landscape is multi-functional & diverse with distributed small settlements, on car-based development patterns.
Climate change risks: "warmer, wetter, wilder" - growing seasons change & fluctuations in freeze/thaw cycle: increasing riverine flooding, heat / drought, water stress is projected: leading to cycle of decline in natural systems function & resilience.
Societal vulnerability: High housing / land prices with strict controls leads to inequality, exclusion & financial stress, economic vulnerability in peri-urban / peri-rural settlements. Landscapes & farming patterns are diverse but vulnerable to ecosystems change.
Governance syndromes: generally effective government & public services, working on the potential for horizontal (sectoral) & vertical (multi-level) integration: active civil society e.g. Greenbelt Foundation: peri-urban & climate awareness is a priority & policy is near best practice:
Adaptive pathways: urban-rural linkages with agro-ecology & circular economy systems: integrated peri-urban design (green development standards), for climate-wise water / drought / heat resilience: potential for eco-real estate markets & climate-wise development patterns:
Adaptive governance: policy integration & capacity building for multi-level government: civic society role for citizens councils / direct democracy: potential for grassroots / social innovations. Toronto brings a global best practice in the Greenbelt Foundation, which aims to integrate urban, peri-urban and rural agendas.
However there may be wider forces which make this task more challenging, especially the ‘game-changing’ potential of climate change.
Toronto region: where is the peri-urban?
Scope: this area includes the Toronto metropolitan area with the 3 lakes ‘horseshoe’: the peri-urban hinterland here has a special focus on the green belt (map below)
Toronto region: system mapping
Climate hazard
(World Bank data profile for Toronto)
Extreme heat - Medium
Wildfire - High
Water scarcity - Very low
River flood - Very low
Urban flood - Low
Coastal flood - No data
Cyclone - Low
Tsunami - No data
Landslide - Very low
Earthquake - Very low
Volcano - No data
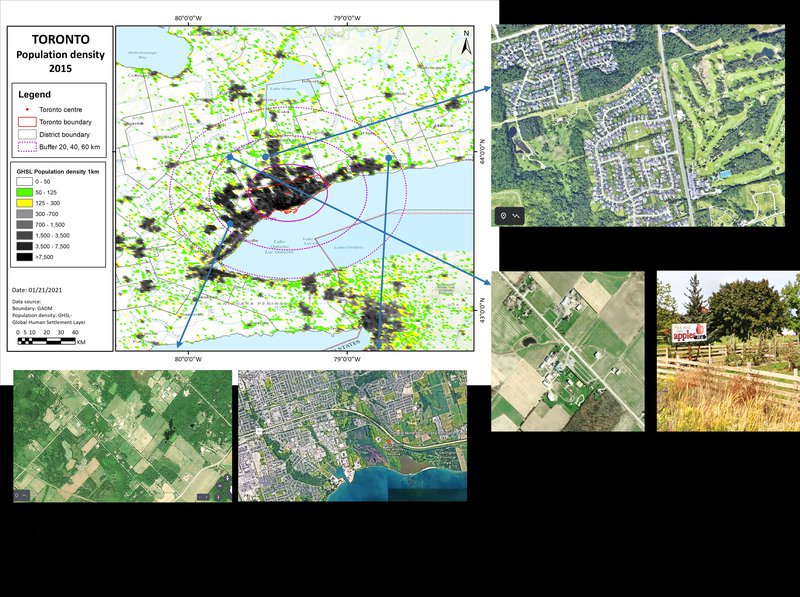
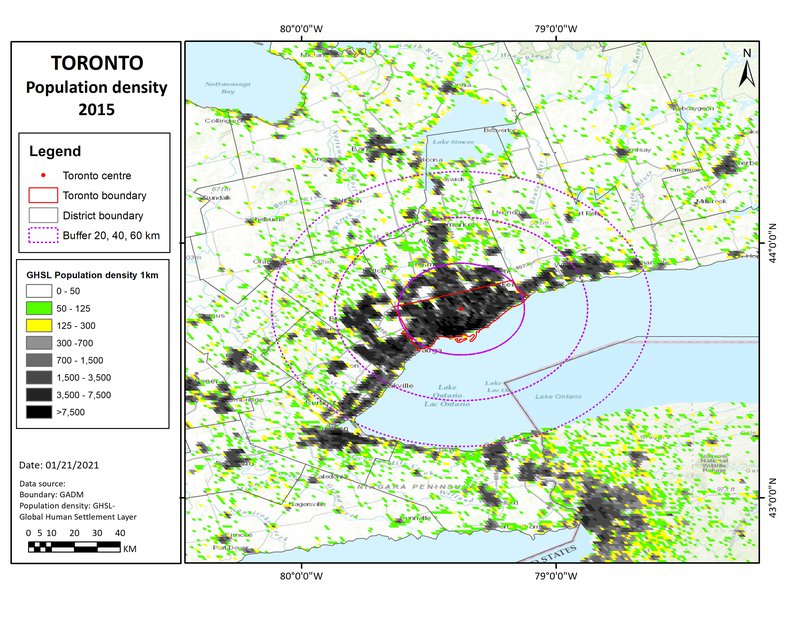
Population density map
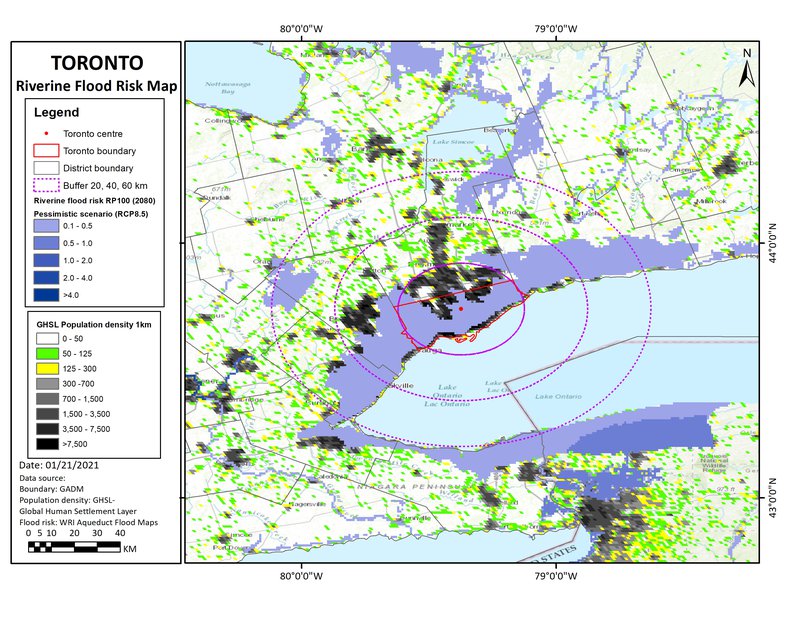
This shows three population density bands: 0-50, 50-125, and 125-300 persons/km2: (transparent for open land, and then green and yellow cells). These are in different proximities to the main urban centres, for the moment defined by distances (from the urban centre), of 0-20, 20-40, and 40-60km: titled 'near-urban', 'near-urban: further urban: and ex-urban / peri-rural'.
Climate projections: river flooding
Including river flooding and related extreme events, this is a ‘reasonable worst case scenario’ for 2080, with reduced policy and pessimistic modelling. This is based on the mapping from https://www.wri.org/resources/maps/aqueduct-global-flood-analyzer
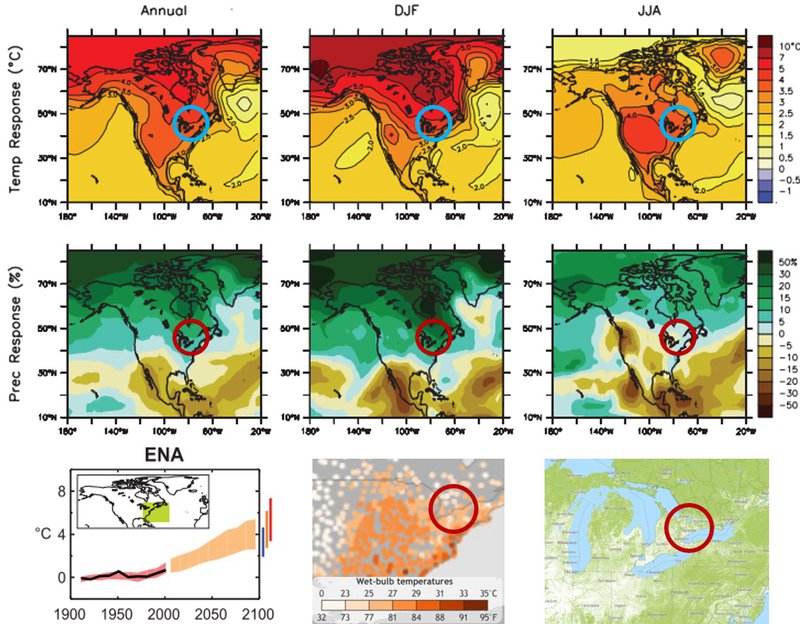
Climate projections: temperature effects
(Top & middle parts include):
- temperature uplift and precipitation uplift, projected with the central ‘A1B’ scenario, for 2080-2100. Source: IPCC - AR4 - WG1 - Chapter 11-1 - https://www.ipcc.ch/site/assets/uploads/2018/02/ar4-wg1-chapter11-1.pdf
(Lower part includes):
- Comparison of projected temperature rise under B1, A1B, A2 emissions scenarios: Source - IPCC - AR4 - WG1 - Chapter 11-1
- Peak wet bulb temperatures 1979-2017: (note TW of 30-350 can be lethal). Source : https://research.noaa.gov/article/ArtMID/587/ArticleID/2621/Dangerous-humid-heat-extremes-occurring-decades-before-expected
- Fire (2020 summer period) & forest cover maps (>30% canopy cover): Source https://www.globalforestwatch.org